Introduction to Flow Cytometric Analysis
You are here
The following is an introduction to the principles of flow cytometric analysis of hematolymphoid neoplasia. We have several normal cases posted that you can download and view using the FCS Express Reader. These cases contain a detailed explanation about each tube and what are the key features to look for on each tube. This page will just provide a general overview of the principles and thought process behind an analysis.
A typical sample is usually stained with between 10-30 monoclonal antibodies or CD markers. Depending on the capabilties of the instrument (i.e. how many different wavelengths the instrument can acquire simultaneously) this will usually be divided to between 3-10 tubes per sample. Combinations of antibodies allow for 1) identification of specific cell types, 2) determination of the degree of cell differentiation, and 3) recognition of abnormal cells.
The use of immunologic markers to determine the lineage and degree of differentiation of a leukemia has become an essential part of the diagnostic evaluation. This information is invaluable for selecting therapy and for determining prognosis and can help in the detection of relapse or of secondary leukemia.
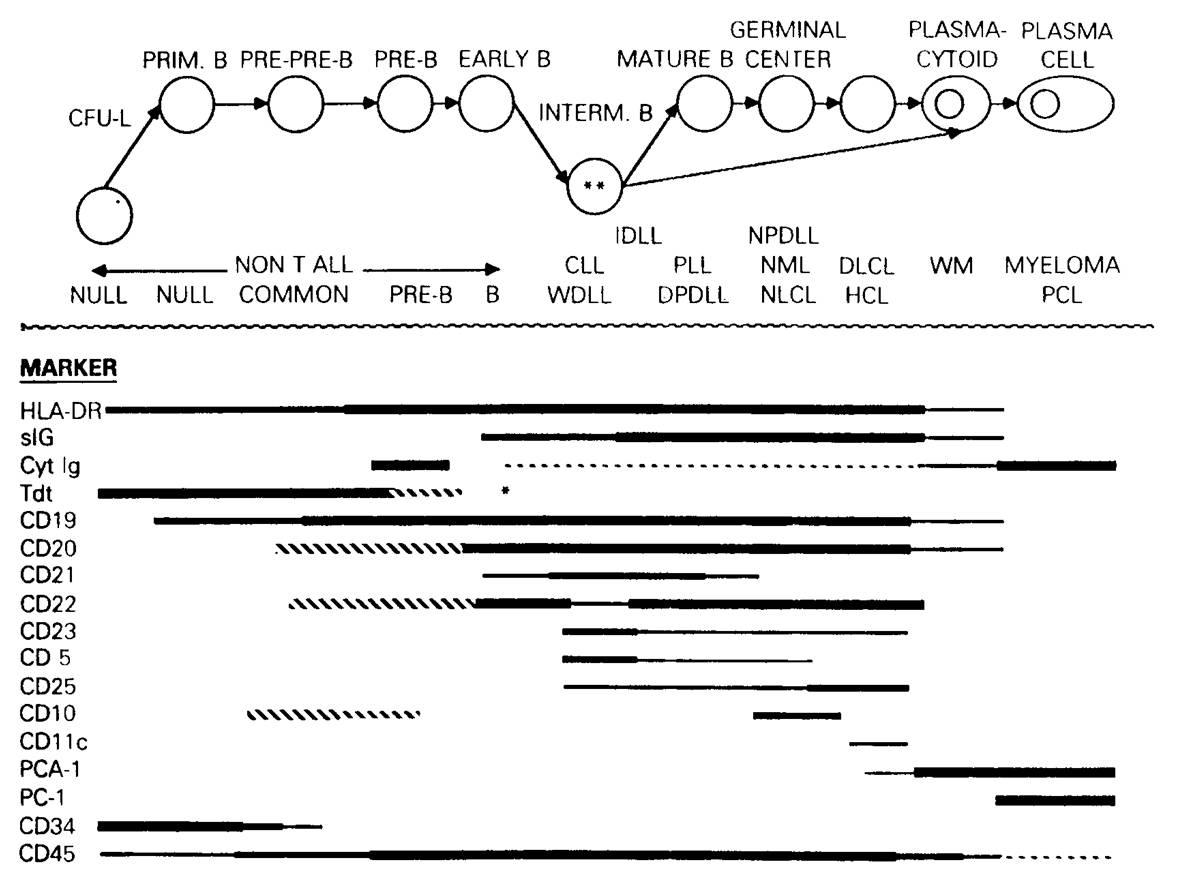
Most of these antibodies are against surface proteins that are not only often associated with particular cell lineages, but vary in expression with maturation, and thus are referred to as differentiation antigens. For instance, in the diagram below, you can see that CD19 is the earliest B specific protein expressed on B cells, but that it is lost as the activated B cell becomes a plasma cell. HLA-DR is not specific to B cells.
The antibodies are generally grouped in lineage specific groupings. A common anchor antibody, typically CD45, is present throughout all of the tubes. A typical panel looks as follows:
| Tube | Antibody combinations | Purpose |
| 1 | CD5/CD19/CD45/CD10 | Idenify and characterize B cell malignancy |
| 2 | kappa/lambda/CD45/CD19+CD20 | Identify B cell clonality |
| 3 | FMC7/CD23/CD45/CD20 | Characterize B cell malignancy |
| 4 | CD7/CD56/CD45/CD3 | Identify T cell malignancy |
| 5 | CD8/CD38/CD45/CD4 | Identify T cell and plasma cell malignancy |
| 6 | CD15/CD117/CD45/CD34 |
myeloid differentiation |
| 7 | CD16/CD13/CD45/HLA-Dr |
myeloid differentiation |
| 8 | CD11b/Mo2/CD45/CD64 | myeloid differentiation |
| 9 | CD45/PI | DNA ploidy and S-phase fraction |
Above is an example panel used for peripheral blood and bone marrow samples. The antibodies and combinations were selected based on the preference of one particular laboratory. There is currently no standard recommended set of marker combinations. The Bethesda Consensus does provide recommended markers for each category of case types. The lab's fresh tissue panel is identical to the above, but omits tubes 6, 7, and 8.
The precise makeup of a panel is usually lab specific, and can depend on many factors. There are generally two approaches:
1. Shotgun approach - this approach involves using a large number of antibodies (generally 25-35) for each patient. The antibodies chosen generally allow you to diagnose most disorders with a minimum number of extra tubes. This may seem excessive and potentially expensive, as one is using more antibodies than is generally needed, but can actually be quite efficient since every sample is prepared exactly the same way and the sample rarely needs to be re-stained. Most large labs (>70 cases per day) use this approach.
2. Screening approach - this involves using a minimal set of antibodies (generally 10-20) for each patient. In the event an abnormality is detected, the sample is generally stained with a subsequent set of antibodies that are targeted towards the abnormality. This approach generally uses less antibodies than the shotgun approach but can be more time consuming.
Initial Gating
CD45 is a very important anchor marker because, in conjuction with Side Scatter (or Forward Scatter), it allows one to identify most of the important populations on a single plot. By placing CD45 in each tube, one can make consistent gates for the different cell populations across all samples.
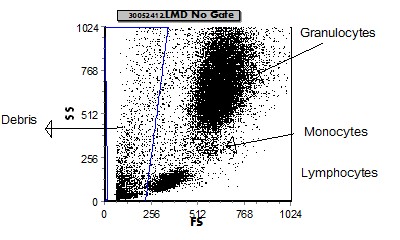
a. Example peripheral blood (or bone marrow) CD45 gating dot plot.
 |
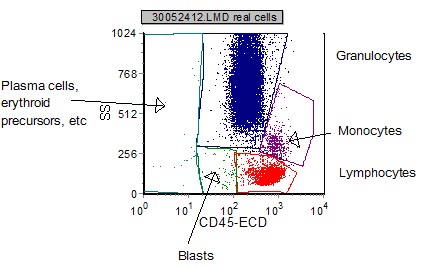 |
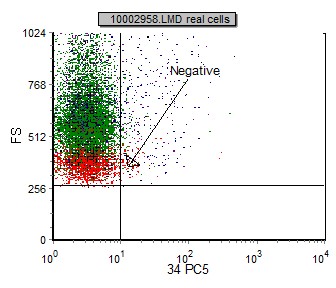
| FS vs SSC is used initially to remove "debris" and non-cellular elements. | CD45 vs SSC on the "real cells" (non-debris) is used to identify the cellular elements based on which region they appear. |
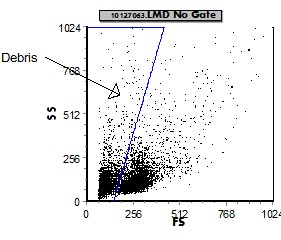
b. Example fresh tissue CD45 gating dot plot.
 |
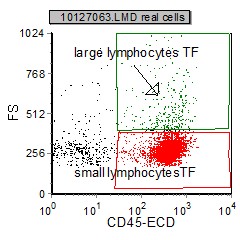 |
| A FS vs SSC display is used initially to remove (gate out) "debris" and non-cellular elements. | CD45 vs FS on the "real cells" is then used to categorize the cellular elements based on which region (large or small) they appear. |
Once the populations are identifed and "painted" specific colors, further analysis tools can be used as described below.
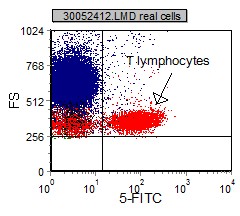
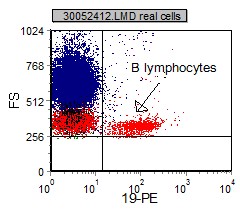
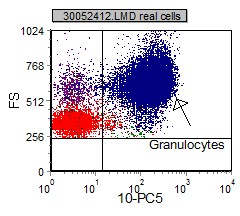
Forward Scatter vs Fluorescence:
Displaying forward scatter (FS) vs Fluorecence (FL) is a useful tool that allows one to visualize all the populations in the sample and their respective size and fluorescent intensity for each marker.
 |
 |
 |
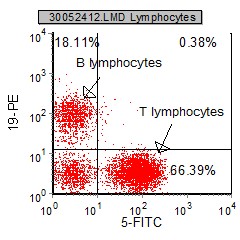
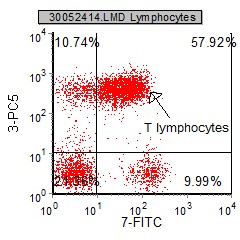
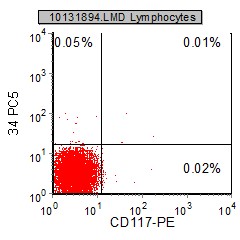
Once a population of interest is identified and painted, a more specific review of the marker expression on the selected population can be done. Dual parameter dot plots are gated population where two different markers are paired and assessed together. Mutually exclusive marking is where a population only expresses one marker and not the other. Co-expression is where a population expresses both markers. Non-expression is when the population of interest does not express either population.
 |
 |
 |
|
Mutual exclusive markers - CD19 and CD5 stain either one population on another, but never both. |
Co-expression - there are many cells that are both CD3+ and CD7+. It is said that CD3 and CD7 co-express on T Lymphocytes |
Nonexpression - The gated lymphocytes do not express CD34 or CD117. |
The diagnosis and subclassification of hematopoetic malignacies relys not only on the distinction of positive and negative expression of the analyzed marker or fluorescence intensity, but also on the identification of the coexpression of two or more markers by the same population of cells. For example, B-CLL/SLL and hairy cell leukemia (HC) are characterized by co-expression of CD5/CD19 and CD25/CD103, respectively.
Fluorescence Intensity
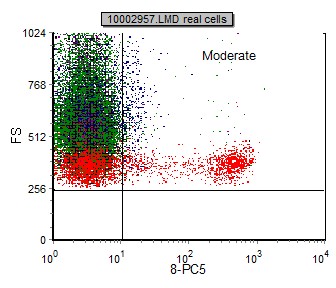
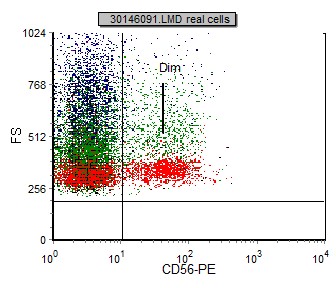
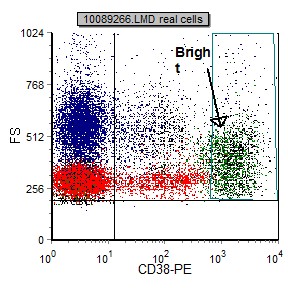
The fluorescent staining intensity is determined by comparison of the negative control and the staining of each antibody. Negative staining is defined by fluorescent intensity similar to that of a negative control (generally in the first decade of fluorescence). The staining is positive when the fluorescence of any given marker is greater than that of the negative control (internal negative or isotype control). In general, positive staining can be categorized as dim, moderate, bright or variable. Dim staining is defined as slightly increased when compared to the negative control. Moderate staining is defined as at least one log decade brighter than the negative control. Bright staining is defined as at least two log decades brighter than the negative control. (See examples below)
 |
 |
 |
 |
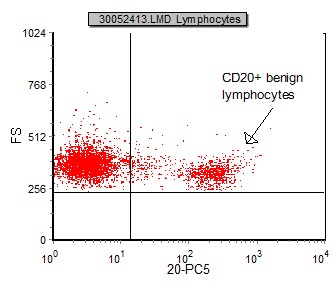
In some neoplasia, fluorescent intensity may be different from that of the normal/benign counterpart. This comparison is a helpful tool in identifying and characterizing a malignancy. One example is that normal B lymphocytes express CD20 with moderate fluorescent intensity; however, in many cases of B-CLL/SLL, CD20 is very dim. (See below)
 |
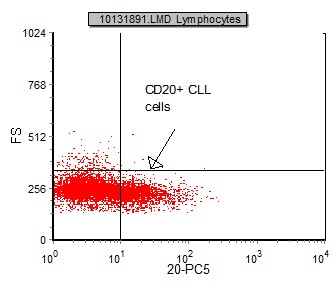 |
| This is an example of FS vs CD20 gated on benign lymphocytes. CD20 has moderatefluorescent intensity. | This is an example of FS vs CD20 gated on CLL lymphocytes. CD20 has dim fluorescent intensity. |
Aberrant Expression of Antigens:
Benign B-cells express the following markers (e.g. CD19, CD20, CD22, CD79a) and negative for T-cell markers (CD2, CD3, CD5, CD7) and conversley, normal T-cells are positive for T cell antigens and negative for B cell markers. Other cell lineages have characteristic immunophenotypic profiles. Positive expression of a marker(s) not associated with a specific lineage, or absence of an antigen which is normally positive, is termed an aberrant antigen expression. Presence of aberrancy not only helps identify a neoplastic process, but is helpful in case followup to identify cells for minimal residual disease (MRD).
Below is a table that shows aberrant antigen expression in B cell lymphomas:
| CD5-negative MCL | 11% |
| CD23-negative B-CLL/SLL | 4% |
| CD10-positive HCL | 12% |
| CD19-positive PCD(myeloma) | 2% |
| CD56-positive DLBCL | <1% |
| CD10-negative FL | 6% |
Below is a table that shows aberrant expression of pan-T cell antigens in non-T cell disorders:
| CD2 | APL, blastic NK-Leukemia/lymphoma, mast cell disease |
| CD3 | Primary effusion lymphoma |
| CD5 | B-CLL/SLL, MCL (denovo), DLBCL, thyoma/thymic carcinoma |
| CD7 | AML, APL, blastic NK-Leukemia/lymphoma,monocytic leukemia, AML with NK differentiation. |
*****The MOST important step in flow cytometric analysis is becoming VERY FAMILIAR with the patterns and markings ofNORMAL samples, so you can recognize and identify ABNORMAL. *****
Sample Normal Cases
Click here for instructions on how to download the free FCS Express Reader to view and manipulate the sample cases.
| Case Name (click on case name to open) |
Comments | Size |
| Normal LN | A typical (normal) sample from a lymph node | 1.5 Mb |
| Normal PB-1 | A typical (normal) sample from peripheral blood | 3.75 Mb |
| Normal PB-2 | A typical (normal) sample from peripheral blood | 5 Mb |
| Case #3 | Normal sample with polyclonal B and minimal T lymphocytosis This case was kindly provided by the ASCP Press. It is part of Flow Cytometry in Clinical Diagnosis by John Carey, Phil McCoy and David Keren. |
1527 kB |
| Normal peripheral blood processed by UTMC for comparison with their wiki cases | 4.9 MB |